Cut to 8–12 KPIs for Your Service Business and Automate in 90 Days
Cut to 8–12 KPIs for Your Service Business and Automate in 90 Days

Track a shortlist, not a spreadsheet. The KPIs that are generally most important for a small-to-midsize service business include gross margin per job, revenue per technician per day, utilization rate, average ticket size, customer retention or lifetime value, first-time fix rate (or on-time delivery), and days sales outstanding (DSO). That’s your minimum viable dashboard, typically expanded to 8 to 12 total, each one owned by a specific person and reviewed on a fixed schedule. Below, you’ll find the formulas, the review cadence, and the fastest path to automating the whole thing.
TL;DR:
- Most small-to-midsize service businesses should focus on 8 to 12 key KPIs, including gross margin per job, utilization rate, revenue per technician, DSO, and customer retention.
- KPIs must connect to clear goals, have trustworthy data sources, and prompt specific actions within the appropriate review cadence to be effective.
- Automating data collection from a unified platform reduces manual reconciliation errors and improves KPI tracking accuracy.
- Prioritizing metrics like gross margin, utilization, and DSO helps identify potential profit leaks, scheduling inefficiencies, and cash flow issues early.
- Using separate dashboards for leadership, operations, and sales teams ensures relevant KPIs are reviewed at optimal intervals, avoiding information overload.
Table of Contents
- What Are the Core KPIs for a Service Business?
- How Do You Choose Which KPIs Actually Matter?
- How Do You Calculate the Most Common Service KPIs?
- Which KPIs Belong on Daily, Weekly, and Monthly Dashboards?
- Putting It Into Practice With MyBizApps
- What Actually Breaks KPI Programs
- Get Your Data Out of Five Spreadsheets and Into One View
- Sources
- FAQ
What Are the Core KPIs for a Service Business?
A service business runs on four kinds of information: money coming in, work getting done, customers sticking around, and people performing. Miss any one of those categories and you’re flying with a blind spot, which is exactly why Expansive EDGE recommends every leadership dashboard include at least one metric from each quadrant.

Here’s a working set organized by category, with cadence and what each one tells you.
Revenue and financial
- Gross margin per job — job revenue minus direct costs (labor, materials, subcontracted work). Review weekly. This is lagging, and it’s the single best signal of whether you’re pricing jobs correctly.
- Revenue per technician per day — total field revenue divided by tech-days worked. Review weekly. Leading indicator of scheduling efficiency.
- Average ticket size — total revenue divided by number of jobs. Review monthly. FixyFlow tracks this as one of the core weekly metrics for field-service operators, since a drop often signals upsell or estimating problems before revenue drops.
- DSO (days sales outstanding) — how long it takes to collect on invoices. Review weekly. Lagging, but it’s your earliest warning for a cash crunch.
Operations and delivery
- Utilization rate — billable hours divided by available hours. Review weekly. Leading indicator that predicts revenue two to four weeks out.
- First-time fix rate — jobs resolved on the first visit divided by total service calls. Review weekly. VSight’s field-service benchmarks treat this as one of the strongest cost-to-serve predictors in the industry, since every return trip eats margin twice.
- On-time delivery or job completion rate — jobs finished within the promised window. Review weekly. Lagging but directly tied to customer complaints.
Customers
- Customer retention or lifetime value (CLV) — percentage of customers who rebook, or total revenue expected from an average customer relationship. Review monthly. Lagging, and usually the most underweighted metric on a small business dashboard.
- Net Promoter Score (NPS) — a simple post-job survey score. Review monthly or quarterly. Leading indicator for churn.
People
- Employee retention — a lagging but critical metric, since technician turnover quietly destroys utilization and first-time fix rates at the same time.
That’s 10 KPIs. Most owners land somewhere in the 8 to 12 range once they cut for relevance, which lines up with what SCORE recommends for small businesses building a metrics-driven culture: start with a few, verify them against both individual and aggregate results, then expand carefully.
How Do You Choose Which KPIs Actually Matter?
Most owners don’t fail at KPI tracking because they pick bad metrics. They fail because they pick too many, assign no owner, and never define what happens when a number turns red. Here’s the filter to run every candidate KPI through before it earns a spot on your dashboard.
- Does it connect to a real goal? If you can’t finish the sentence “we track this because we’re trying to ___,” cut it. A metric with no strategic tie is trivia, not intelligence.
- Is there one reliable source for it? If gross margin lives half in your accounting software and half in a tech’s memory, it’s not trustworthy yet. Fix the data source before you put the number on a dashboard.
- Can someone actually act on it? This is the real KPI-versus-metric distinction. A metric describes what happened. A KPI triggers a decision. If a number turning red doesn’t cause someone to do something specific within 48 hours, it’s a metric, not a KPI, and it belongs in a report, not a dashboard.
- Does the cadence match the decision speed? Utilization needs weekly eyes. CLV can wait a month. Forcing a slow-moving number into a daily huddle just trains people to ignore it.
Once a KPI clears all four filters, set thresholds before you start tracking: green (on target), yellow (watch, no action required yet), and red (owner must act within a set window). Assign one named owner per KPI, not a department. Then run a 90-day pilot with your 8 to 12 finalists before adding a single additional metric.
Pro Tip: Resist the urge to add a ninth KPI in week three because something interesting showed up in the data. Write it down, wait out the full 90 days, then decide if it earns a permanent slot.
How Do You Calculate the Most Common Service KPIs?
Formulas only matter if you know exactly where the numbers come from. Here’s the breakdown, with the data source and the mistake that trips up most owners.
- Utilization rate = billable hours ÷ available hours. Pull from your scheduling or timesheet system, measured weekly. Pitfall: counting drive time or admin work as “available” inflates the denominator and hides a scheduling problem.
- Gross margin per job = (job revenue − direct job costs) ÷ job revenue. Pull labor and material costs from accounting, tied to the specific job in your invoicing system. Pitfall: forgetting to allocate a technician’s hourly cost accurately, which quietly overstates margin on every job.
- Revenue per tech per day = total field revenue ÷ total tech-days worked. Measure weekly from combined scheduling and invoicing data.
- Average ticket size = total revenue ÷ number of jobs, measured monthly from your invoicing history. FixyFlow’s benchmark table is a useful reference point if you want a range to compare against.
- CAC (customer acquisition cost) = total sales and marketing spend ÷ new customers acquired, measured monthly or quarterly from your CRM and accounting records combined.
- CLV = average job value × average jobs per year × average customer lifespan in years.
- DSO = (accounts receivable ÷ total credit sales) × number of days in the period. The SBA’s finance management guidance treats this as a basic cash-management number every small business should watch monthly at minimum, weekly once cash gets tight.
- First-time fix rate = jobs resolved in one visit ÷ total service visits, pulled from work ticket data.
- Quote-to-close rate = jobs won ÷ quotes sent, from your CRM or quoting tool.
A spreadsheet handles all of this fine at first. Simple tooling with the right owners beats a complex system nobody opens. Graduate to software once you’re manually re-entering the same job data into three different places, because that’s usually the moment someone stops updating the sheet altogether.
Which KPIs Belong on Daily, Weekly, and Monthly Dashboards?
Different KPIs demand different audiences and different clocks. Trying to review gross margin and cash runway in the same five-minute huddle where you’re checking today’s schedule wastes everyone’s time and buries the numbers that actually need daily attention.
Build three separate views instead of one crowded dashboard:
- Leadership dashboard (quarterly, with a monthly check-in): gross margin trend, cash runway, CLV, employee retention. These are strategic and slower-moving.
- Operations dashboard (weekly, daily for cash and safety flags): utilization, revenue per tech per day, first-time fix rate, on-time delivery.
- Sales and marketing dashboard (weekly for pipeline, monthly for CAC): quote-to-close rate, CAC, average ticket size trend.
Layer your cadence on top of that split: daily glances at cash position and any safety-critical flags, a weekly operation review for the numbers that move fast, a monthly financial close for margin and DSO, and a quarterly session for the strategic metrics leadership actually decides on. Rhythm Systems’ KPI research found dashboards mostly get opened when they’re tightly scoped, owned, and matched to the right audience, not when they try to show everyone everything.
One rule kills more KPI programs than any other: if a metric requires manual reconciliation across two systems before anyone trusts it, it will eventually stop getting reported. Pick a single source of truth for each number and name one owner who’s accountable when it turns red.

Putting It Into Practice With MyBizApps
Most of the KPI list above maps directly onto specific data sources you may already be collecting without realizing it. Scheduling data feeds utilization and revenue per tech. Invoicing and accounting feed gross margin and DSO. Work tickets feed first-time fix rate and job completion.
A platform that keeps those functions under one login removes the manual reconciliation step that kills most KPI dashboards. Here’s a rough 30/60/90 path:
- Days 1 to 30: connect scheduling and work tickets, so utilization and first-time fix rate calculate automatically.
- Days 31 to 60: link invoicing and accounting for gross margin and DSO reporting.
- Days 61 to 90: automate the weekly operations report and the monthly financial snapshot, then add customer or NPS tracking.
What Actually Breaks KPI Programs
Three mistakes account for most failed dashboards. Overtracking is the biggest one: owners pile on 20 metrics in month one and stop checking any of them by month three. The second is no owner. A KPI without a name attached is a chart nobody feels responsible for. The third is a shaky source of truth, where the same number differs depending on which spreadsheet you open.
The fix is almost always the same: cut to 8 to 12 KPIs, assign one owner per number, and pick a single system of record. Small businesses that trim their dashboard down to that range consistently report checking it more often, simply because it takes 90 seconds instead of 20 minutes.
— Philip
Get Your Data Out of Five Spreadsheets and Into One View
Mybizapps is the alternative to duct-taping together a scheduling app, a separate invoicing tool, and a spreadsheet for margin tracking. Every module, from scheduling to work tickets to accounting, runs under one login, so the numbers that feed your KPI dashboard, utilization, gross margin, DSO, first-time fix rate, come from the same source every time instead of three conflicting ones.
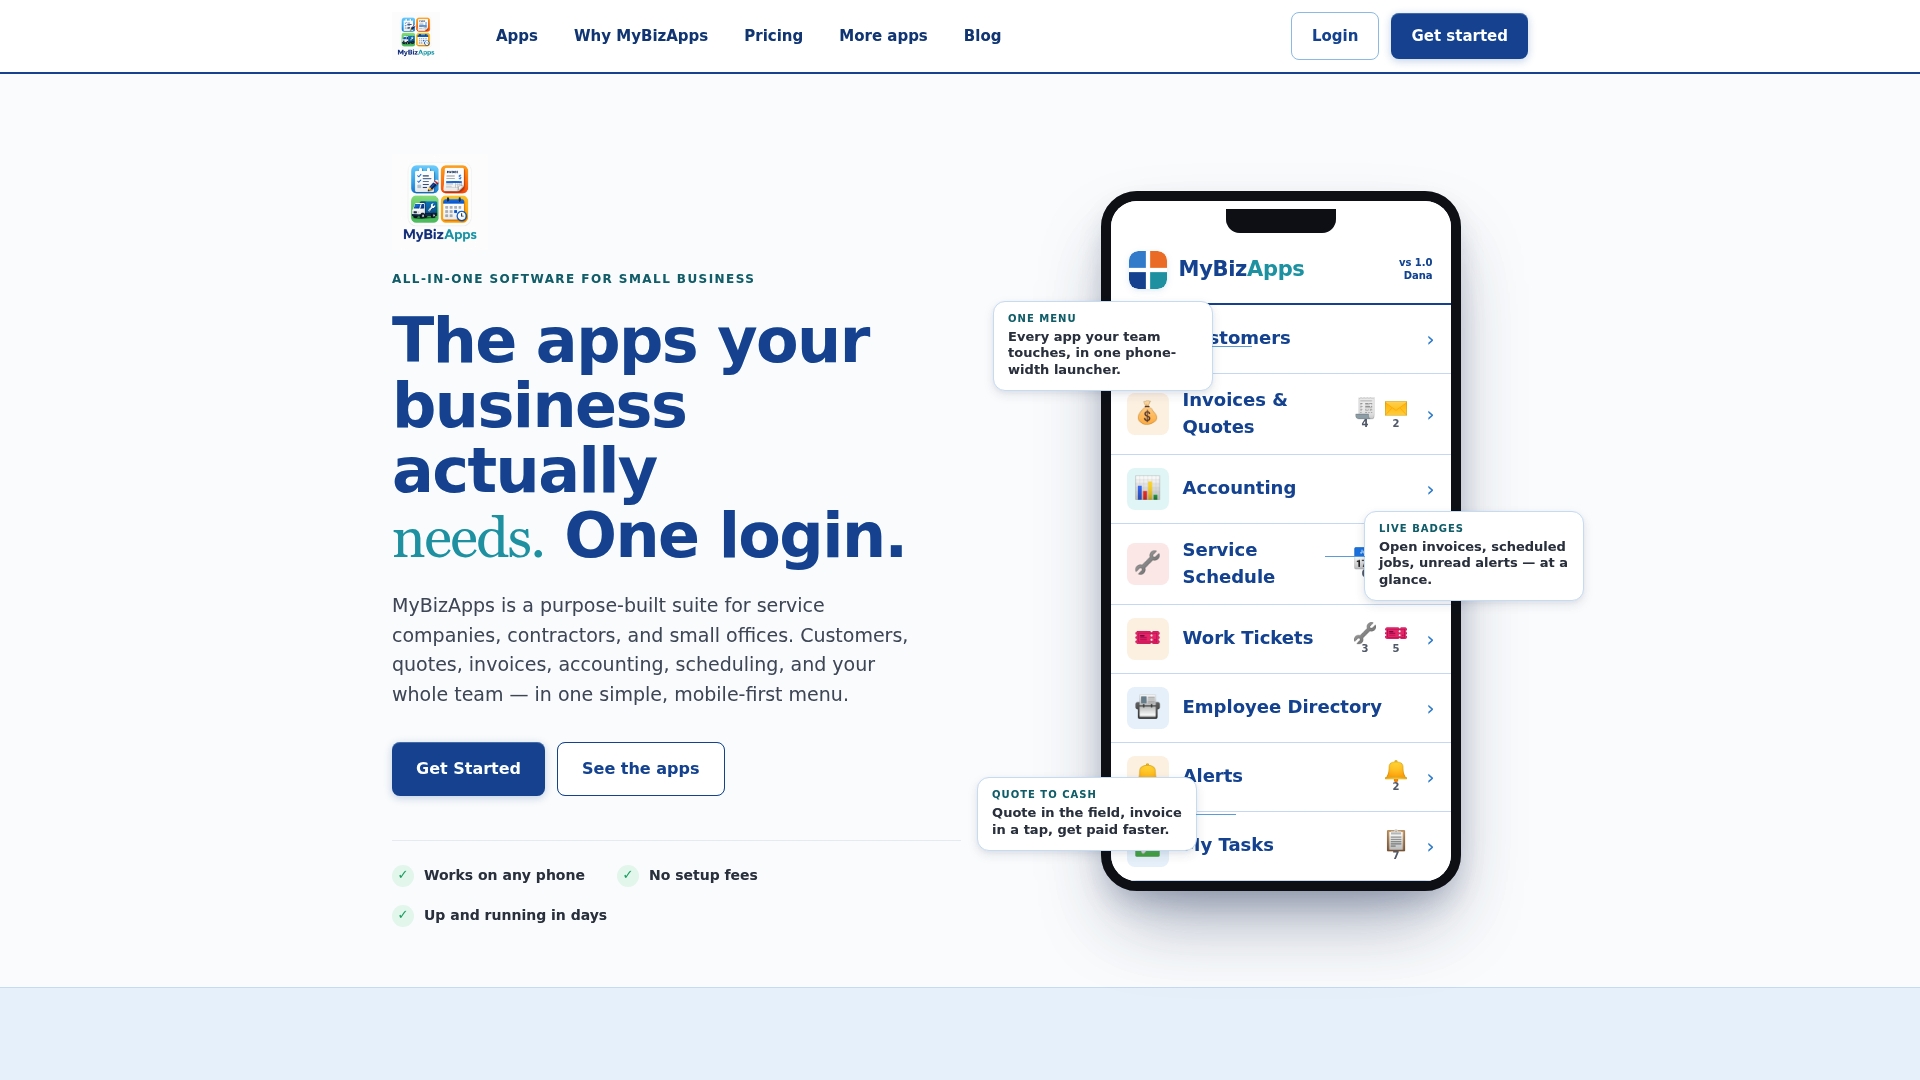
If cash flow visibility is your biggest gap right now, start with the quote-to-cash workflow and the bookkeeping practices that keep your DSO calculation trustworthy. From there, map your three canonical data sources (scheduling, invoicing, work tickets), assign an owner to each KPI, and check the pricing page to see which modules fit your setup, current prices are on the pricing page. If you run an oil change shop specifically, the Oil Change Shop plan is built around that exact workflow.
Sources
For benchmark ranges, ownership rules, and cadence guidance beyond what’s covered here, check the SBA’s KPI guidance, SCORE’s data-driven small business advice, and field service benchmark formulas from VSight. Also worth a look: dashboard design guidance from EnerlyticsAI’s site dashboard resources for combining leading and lagging metrics in one view.
- How to use data to boost your small business (SCORE)
- KPIs and Metrics for Service Businesses (Expansive EDGE)
- 15 Service Business KPIs to Track Weekly (FixyFlow)
- Field service KPIs: Formulas & benchmarks (VSight)
FAQ
What Are Good KPIs to Track for a Service Business?
Gross margin per job, utilization rate, revenue per technician per day, first-time fix rate, DSO, and customer retention cover the core categories: money, operations, customers, and people. Most small service businesses land on 8 to 12 total once they add average ticket size and CLV.
What Are the 5 Main KPIs a Small Business Should Watch?
There’s no single universal five, but a defensible minimum is gross margin, utilization, revenue per tech per day, DSO, and customer retention. SBA guidance supports keeping the list this tight and reviewing it on a fixed schedule rather than tracking everything available.
What Are the Key Performance Indicators for a Service Business Specifically?
Service businesses need indicators split across four areas: financial (gross margin, DSO), operational (utilization, first-time fix rate), customer (retention, NPS), and people (employee retention). Field service benchmarks put particular weight on first-time fix rate since repeat visits erode both cost and customer trust.
What Are the Top 3 Business Metrics Most Owners Should Track First?
If you’re starting from zero, prioritize gross margin per job, utilization rate, and DSO. Those three cover profitability, delivery efficiency, and cash flow, the three areas most likely to sink a service business if left unmonitored.
Do I Need Special Software to Track These KPIs?
No, a spreadsheet works fine when volume is low and someone owns the update. Once you’re manually re-entering the same job data across multiple tools, a platform like Mybizapps that centralizes scheduling, invoicing, and work tickets under one login removes that reconciliation step entirely.